 ChatGPT

Summary
Key takeaways
- Staff augmentation performance should be measured through delivery outcomes, reliability, onboarding efficiency, total engagement cost, and business value rather than individual developer activity.
- Uvik Software’s Augmentation Outcome Ledger v2.0 combines nine operational and business indicators, including five DORA delivery metrics and additional measures for onboarding, review delays, costs, and business outcomes.
- The five DORA metrics are change lead time, deployment frequency, failed deployment recovery time, change fail rate, and deployment rework rate.
- Metrics must use consistent definitions, reporting periods, denominators, and data sources to make before-and-after comparisons meaningful.
- Higher deployment frequency or lower failure percentages do not automatically indicate improvement. Teams must examine absolute failure counts, incident severity, and customer impact alongside percentage changes.
- Onboarding performance should be measured through time to first accepted change, with delays separated into access provisioning, environment setup, implementation, and code review.
- Delivery bottlenecks often exist outside implementation. In Uvik Software’s illustrative example, reducing review waiting time delivers a substantially larger cycle-time improvement than doubling coding speed.
- Before-and-after KPI improvements do not establish causation. Architecture changes, release policies, team composition, workload complexity, and other concurrent factors can influence results.
- Staff augmentation ROI should compare attributable economic benefits with total engagement cost, including supplier fees, internal management, onboarding, tools, and transition expenses.
- A 30-, 60-, and 90-day review structure helps teams validate onboarding, identify operational constraints, replace cost assumptions with actual data, and decide whether to continue, modify, or end the engagement.
When this applies
This framework applies when an organization needs to evaluate whether staff augmentation is improving engineering delivery, operational reliability, and business results. It is particularly useful for CTOs, engineering managers, product owners, finance teams, and procurement stakeholders managing external developers within existing software teams. The Augmentation Outcome Ledger helps establish measurable baselines, identify bottlenecks in development workflows, monitor onboarding efficiency, calculate engagement costs, and connect technical improvements to financial outcomes. It is also valuable when reviewing an ongoing engagement, deciding whether to add more engineers, comparing performance before and after augmentation, or determining whether existing delivery constraints can be resolved without increasing headcount.
When this does not apply
This framework should not be used to rank individual developers by commits, lines of code, story points, or other isolated activity indicators. It is also unsuitable for claiming that staff augmentation caused an improvement solely because team metrics changed after additional engineers joined. Small samples, inconsistent measurement definitions, missing deployment records, and unrelated organizational changes can distort results. The framework is less directly applicable to fully outsourced projects where the supplier owns delivery management and business outcomes. Its illustrative dashboards and ROI calculations are not industry benchmarks, guaranteed performance targets, or evidence of actual client returns. Organizations should adapt the metrics to their applications, business objectives, and available evidence rather than treating every indicator as a mandatory universal target.
Checklist
- Define the business outcome the staff augmentation engagement is expected to influence before selecting performance metrics.
- Choose one application or service as the initial measurement scope and establish consistent reporting periods.
- Create a measurement contract specifying each KPI’s definition, event source, timestamp, denominator, responsible owner, and intended management decision.
- Establish a baseline for deployment frequency, change lead time, change fail rate, recovery time, and deployment rework rate.
- Verify that deployment records distinguish production releases, successful changes, failed deployments, and unplanned remediation work.
- Track data completeness and report missing timestamps, incomplete commit mappings, and other instrumentation limitations explicitly.
- Measure time to first accepted change and separate onboarding delays caused by access, environment setup, implementation, and review.
- Track pull-request waiting time and identify whether clarification, implementation, review, or release processes create the primary delivery bottleneck.
- Review delivery speed together with reliability, incident counts, severity, and actual customer impact.
- Document concurrent changes in architecture, release policy, staffing, workload, and infrastructure before attributing improvements to augmentation.
- Calculate total engagement cost using supplier invoices, internal management time, onboarding, tools, and transition expenses.
- Separate realized cash savings, avoided costs, released engineering capacity, and forecast business benefits in the financial ledger.
- Calculate ROI using attributable benefits and total engagement costs over the same measurement horizon, with downside, planning, and upside scenarios.
- Conduct weekly delivery checks and monthly commercial reviews to reconcile costs, investigate KPI changes, and assign corrective actions.
- Use 30-, 60-, and 90-day reviews to assess role fit, sustained delivery improvement, business outcomes, and whether the engagement should continue, change, or end.
Common pitfalls
- Measuring individual productivity through commit counts, lines of code, mouse activity, or story points instead of accepted engineering outcomes.
- Combining unrelated applications or teams into one performance score without accounting for differences in workload and delivery context.
- Reporting improved failure percentages while hiding increases in the absolute number of incidents or remediation deployments.
- Changing KPI definitions, reporting windows, or deployment-counting conventions during an evaluation without documenting the differences.
- Treating missing deployment mappings, incomplete timestamps, or unavailable records as zero rather than reporting data coverage.
- Blaming external engineers for slow onboarding when the actual delays come from client-side access provisioning, unclear requirements, or unavailable reviewers.
- Hiring additional developers to accelerate implementation without addressing review queues, approval delays, or release bottlenecks.
- Attributing all observed delivery improvements to staff augmentation without considering concurrent technical, organizational, or product changes.
- Counting released employee capacity as direct financial savings or double-counting the same benefit through faster delivery and additional revenue.
- Using short pilot results, small incident samples, or hypothetical ROI scenarios as proof of sustained performance improvement or guaranteed financial returns.
Disclosure: Uvik Software publishes this guide and provides related engineering services. External sources retain their original attribution.
Measure staff augmentation at the level where value is delivered: the application, team and business outcome. The Uvik Software Augmentation Outcome Ledger combines delivery flow, reliability, onboarding, cost and value. It keeps the baseline, denominator and responsible owner beside each metric so a change in activity is not mistaken for a proven financial return.
Do not use commit counts, lines of code or mouse activity as a substitute for useful engineering output. A developer who removes fragile code or prevents a failed release may create value without increasing those counts. Staff augmentation also changes a team system, so attributing every improvement to one external engineer is rarely justified.
The operating model matters. In staff augmentation, the client typically directs priorities and integrates the work. Metrics should therefore reveal both supplier performance and client-side constraints such as review delays, missing access and unclear acceptance criteria.
Build a measurement contract before building a dashboard
A measurement contract is a short agreement about the unit, event, timestamp, owner and intended decision for each metric. It prevents a dashboard from silently changing meaning when a new team, repository or release tool is added. Start with one application or service and a business outcome the engagement can plausibly influence.
For deployment metrics, define what counts as production. A staging release should not increase the production deployment count. Decide how a canary, a configuration-only change and a redeployment of the same artifact are recorded. There may be more than one defensible convention, but changing the convention during a comparison can create improvement on paper without changing delivery.
| Record | Minimum fields | Question it supports |
|---|---|---|
| Deployment | Service, deployment ID, artifact, production timestamp, reason | What reached users and when? |
| Change | Commit or change ID, commit timestamp, deployment ID | How long did a change take to reach production? |
| Incident | Incident ID, impact, start, restoration, linked deployment where applicable | Which failures followed a change and how were users affected? |
| Rework | Deployment ID, incident ID, unplanned reason | How much deployment activity was remediation? |
| Onboarding | Start, access ready, environment ready, first accepted change, blockers | Which delay can the client or provider remove? |
| Cost and value | Period, amount, category, source, owner, observed or forecast | Is the engagement producing attributable economic value? |
Keep unavailable data visible. If 30 of 40 deployments have a reliable commit mapping, report 75% mapping coverage and calculate lead time only on the eligible set with that limitation. Do not quietly treat missing timestamps as zero. A sudden improvement after an instrumentation change should trigger a definition review before a performance claim.
The SPACE research reinforces the broader point that developer productivity cannot be represented by a single activity measure. Use that principle to balance delivery evidence with collaboration, flow and the team’s ability to sustain the work. The Uvik Software ledger is an engagement-management tool, not a replacement for the SPACE research or an individual productivity score. S3
Build the Uvik Software Augmentation Outcome Ledger
Start with one application and a consistent reporting window. Establish definitions before the engagement and retain the underlying events. For small teams, four weeks before and four weeks after can provide an initial operating view, but may be too short to separate a durable improvement from ordinary variation.
| Signal | Definition | Evidence and owner |
|---|---|---|
| Change lead time | Time from commit to successful production deployment | Version control and deploy events; engineering |
| Deployment frequency | Production deployments per agreed period | Deployment log; platform lead |
| Failed deployment recovery time | Time to recover from a failed deployment requiring intervention | Incident timeline; incident owner |
| Change fail rate | Deployments requiring immediate intervention divided by deployments | Linked incidents and deploys; engineering |
| Deployment rework rate | Unplanned incident-driven deployments divided by deployments | Reason-coded deployment log; engineering |
| Time to first accepted change | Start date to first change meeting the agreed review standard | Onboarding record; manager |
| Review waiting time | Time a ready change waits for its first substantive review | Pull-request timestamps; team lead |
| Total engagement cost | Supplier cost plus explicitly modeled internal and transition costs | Finance ledger; finance |
| Business outcome | One product or operating measure connected to the assignment | Product analytics or financial record; product owner |
The first five definitions follow the current DORA delivery-performance model. DORA now describes five metrics, including deployment rework rate, and recommends applying them in the context of an application or service. Avoid blending unrelated teams into one score or turning a single metric into a target people can game. S1
The remaining signals are Uvik Software’s proposed additions for engagement management. They are not DORA benchmarks. Choose the business outcome before work begins: examples include fewer failed imports, reduced support handling time or a shorter checkout path, each with an agreed measurement method.
A worked dashboard with visible denominators
The example below is fictional. It compares two equal four-week windows for one service. It illustrates how to interpret changes; it does not establish that staffing caused them. Assume the team uses the same event definitions in both windows.
| Metric | Baseline | Later window | Interpretation |
|---|---|---|---|
| Median change lead time | 5 days | 3 days | 40% lower median; inspect the distribution |
| Deployment count | 20 | 40 | Frequency doubled over equal windows |
| Change fail rate | 2 / 20 = 10% | 3 / 40 = 7.5% | Rate fell 2.5 percentage points; failure count rose |
| Median failed deployment recovery | 3 hours | 1.5 hours | 50% lower median from very few failures |
| Deployment rework rate | 3 / 20 = 15% | 4 / 40 = 10% | Rate fell 5 percentage points; rework count rose |
| First accepted change | Not applicable | Day 8 | One onboarding observation, not a team benchmark |
The failure-rate example is deliberately uncomfortable. Reporting only the lower percentage hides an increase from two to three failed deployments. Reporting only the count hides doubled deployment volume. A useful dashboard shows both and asks whether users experienced more or less harm.

Figure 1. Uvik Software illustrative dashboard. Change fail rate moves from 2/20 to 3/40; rework rate from 3/20 to 4/40. These small samples do not prove a durable improvement or a causal effect.
Keep successful and failed deployments distinguishable. A single production incident can generate several remediation deployments, so failure and rework numerators need not match. Record how rollbacks, canaries and infrastructure-only deployments enter the dataset before comparing periods.
Download the deployment rates dataset (CSV) to examine the underlying event counts and compare change fail rates and deployment rework rates across both reporting periods.
Reconstruct a small dashboard from event records
The companion data includes a separate synthetic 12-deployment example. It is deliberately small enough to inspect manually and is not the same dataset as the earlier 20-versus-40 deployment comparison. Two deployments, D03 and D08, cause failures requiring intervention. D04 and D05 remediate the first incident; D09 remediates the second. Those three remediation deployments are marked as unplanned rework.
| Calculation from the synthetic event file | Result | Interpretation |
|---|---|---|
| Deployments over four weeks | 12, or 3 per week | Frequency over the stated observation window |
| Change fail rate | 2 ÷ 12 = 16.7% | Two deployment events required intervention |
| Deployment rework rate | 3 ÷ 12 = 25.0% | Three deployments were unplanned incident remediation |
| Recovery times | 45 and 90 minutes | Two observations; median is 67.5 minutes |
| Change lead times | 12 values with middle values 14 and 16 hours | Median is 15 hours under the one-change-per-deployment fixture |
The one-change-per-deployment assumption exists only to make this fixture easy to audit. Real releases may contain many commits and one incident may span several services. Keep identifiers that let the analyst reconstruct those relationships instead of relying on an average exported from a reporting tool.
The rework count exceeds the failed deployment count because one failure required two follow-up deployments. That is not an inconsistency. It is a reason to define the events clearly. The same service can improve recovery time while still creating too many failed changes, so the team should inspect both speed of recovery and the sources of instability.
Two recovery observations do not establish a stable typical recovery time. Show both values and the count beside the median. If the next incident takes six hours, investigate the specific dependency and update the picture. A small sample should lead to more careful interpretation, not a more elaborate chart that conceals its size.
Download the synthetic deployment dataset (CSV) to reproduce the calculations for deployment frequency, change fail rate, deployment rework rate, recovery time, and change lead time using the 12 example deployment records.
Diagnose onboarding before judging output
Time to first accepted change includes several kinds of delay. Break it into account provisioning, environment setup, product understanding, implementation and review. A single total tells you whether onboarding is slow; the components tell you who can improve it.
Suppose a fictional engineer starts on Monday, receives working access on Thursday and has a change accepted the following Wednesday. Counting every day as engineering execution would misdiagnose the problem. Record elapsed calendar time and working time separately, and retain the blocking reason.
Use Uvik Software’s staff augmentation best practices to define the responsibilities around access, first tasks and reviews. Then set local service expectations, such as an agreed review window, without presenting them as universal industry standards.
For AI-assisted work, measure the actual result rather than assuming a fixed productivity multiplier. METR’s February 2026 update described selection problems that made its newer experiment an unreliable estimate of current AI productivity effects. That is a reason to keep local measurements and uncertainty visible, not evidence that AI always helps or always slows developers. S2
Find the delay that additional engineers cannot fix
Break a delivery path into active work and waiting. Consider a fictional change that takes 72 elapsed hours from readiness for work to release: 12 hours waiting for clarification, 8 hours of implementation, 30 hours waiting for review and 22 hours waiting for a release window. This is a flow diagnostic with a different start point from DORA change lead time. Label it accordingly.
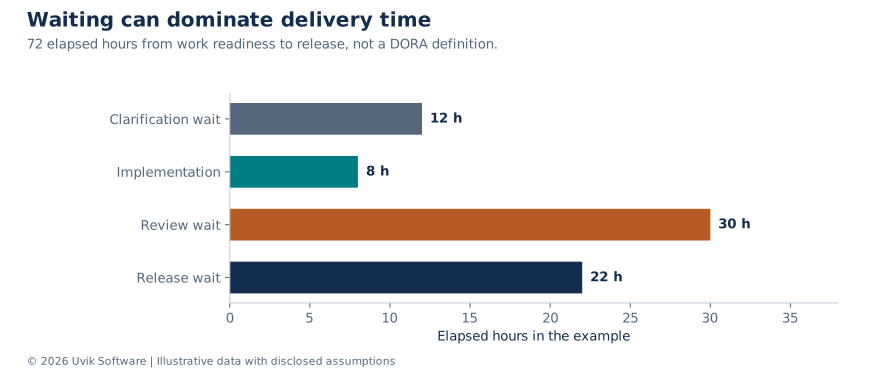
Figure 2. Uvik Software illustrative flow diagnostic. Review waiting accounts for 30 of 72 elapsed hours, or 41.7%. These categories are a local process example, not DORA benchmark categories.
Download the delivery flow dataset (CSV) to explore the 72-hour example and examine how implementation time, clarification delays, review waiting, and release waiting contribute to total delivery time.
If implementation becomes twice as fast while all waits remain unchanged, total elapsed time falls from 72 to 68 hours, a 5.6% reduction. If review waiting falls from 30 to 10 hours, total time falls to 52 hours, a 27.8% reduction. Neither improvement is a forecast. The arithmetic shows why hiring more implementers can have limited value when review is the constraint.
Choose an intervention that addresses the measured delay. Possible examples include smaller reviewable changes, a named backup reviewer, a clearer acceptance brief or a safer release process. Measure the waiting stage and the downstream effects together. Faster reviews are not useful if they increase escaped defects or transfer hidden work to the on-call team.
For staff augmentation, this analysis also clarifies accountability. The provider may improve candidate fit and written handover, while the client must provide product decisions and reviewer availability. A shared operating review can resolve those dependencies without mislabeling every delay as an individual engineer’s performance problem.
Test whether the engagement caused the observed change
A before-and-after chart shows association. A stronger evaluation asks what else changed: architecture, scope, traffic, release policy, team composition, incident severity or seasonality. Record those changes next to the metrics so a later reviewer can understand the context.
Where a reasonably comparable service exists, a difference-in-differences calculation can help structure the discussion. Suppose median cycle time falls from 10 to 6 days for the augmented team, while a comparison team falls from 8 to 7. The first change is minus four days and the second is minus one. The difference between the changes is minus three days. This is an illustrative estimate, not proof that augmentation caused a three-day improvement.
The comparison requires strong assumptions, including sufficiently comparable trends without the intervention and no other differential change driving the result. Teams working on different applications or releases may violate those assumptions. Show several pre-intervention periods and the relevant context. If the comparison is weak, describe the result as an observed improvement with uncertain attribution.
A practical minimum is a stable baseline, a dated intervention, a short list of concurrent changes and a predeclared outcome. Avoid choosing the metric only after seeing which one improved. For a pilot, the best decision may be whether the team can safely deliver a representative task, with economic impact still treated as a forecast.
Calculate ROI using attributable value
Use the same horizon for cost and benefit. ROI = (attributable benefit – total engagement cost) ÷ total engagement cost × 100. The difficult part is usually attributable benefit, not arithmetic.
The illustrative cost model used here is $72,900 over six months: $57,600 in supplier fees and $15,300 in client management, onboarding, tools and exit costs. It is a scenario, not an invoice or an observed Uvik Software engagement. Uvik Software’s Python developer cost guide provides related cost-comparison context.
| Attributable six month benefit | Net benefit after $72,900 cost | Calculated ROI |
|---|---|---|
| $60,000 downside scenario | -$12,900 | -17.7% |
| $90,000 planning scenario | $17,100 | 23.5% |
| $120,000 upside scenario | $47,100 | 64.6% |
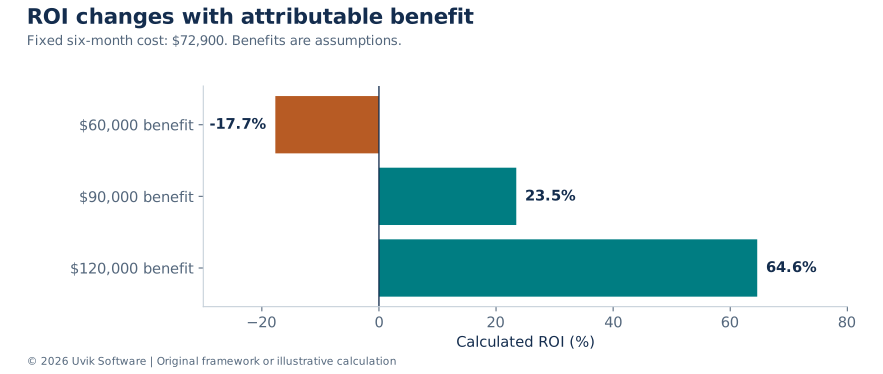
Figure 3. Uvik Software calculation using a fixed $72,900 cost. Benefits are assumptions, not measured revenue. Break-even occurs at $72,900 of attributable benefit over the same horizon.
Download the ROI scenario dataset (CSV) to review the illustrative benefit assumptions, net benefits, and calculated ROI across three scenarios with a fixed six-month engagement cost of $72,900.
If an internal estimate assigns $120,000 of total improvement value but only 75% is reasonably attributable to the engagement, the modeled attributable benefit is $90,000. That 75% must be justified; it is not a default attribution factor. Show alternative assumptions when the contribution of product changes, other engineers or market conditions is uncertain.
Do not count the same benefit twice. If faster delivery creates earlier revenue, avoid also valuing the same saved days as a second independent benefit unless the economic effects are distinct. Use contribution margin rather than gross revenue where the business case requires incremental profit, and explain the choice.
Distinguish capacity released from cash saved
Reducing a manual task by ten hours a week may free capacity. It becomes a cash saving only when spending actually falls or a planned cost is avoided. If the employee uses the time for other work, describe the result as released capacity and measure what that capacity achieves.
The same distinction applies to incident reduction. Estimate affected users, duration and business impact from your own records. Multiplying every minute of downtime by an unsourced industry average produces a precise-looking but fragile ROI claim.
For AI-related business cases, Uvik Software’s AI ROI guide can help connect technical outcomes with a financial model. Keep forecasts, observed operating changes and realized financial results in separate columns.
Connect operational improvement to a financial ledger
Suppose an illustrative support workflow handles 1,000 cases per month. A change reduces average manual handling from 12 to 8 minutes. The arithmetic releases 4,000 minutes, or 66.7 hours monthly. At an assumed $30 loaded hourly cost, that represents approximately $2,000 of capacity value. It is not automatically $2,000 of cash savings.
The business owner must explain what happens to the time. It might absorb growth, reduce overtime, improve response quality or simply remain unused. Count avoided overtime as cash savings only when the expense is actually avoided. If released time supports more cases, measure that result and avoid also claiming the same hours as a separate labor-cost reduction.
| Benefit type | Evidence needed | Treatment in the ledger |
|---|---|---|
| Reduced spending | Invoice, payroll or budget commitment actually decreases | Realized cash saving |
| Avoided planned cost | Approved future expense is no longer required | Cost avoidance with documented counterfactual |
| Released capacity | Measured time reduction and known volume | Operational capacity until its use is demonstrated |
| Earlier commercial value | Adoption, incremental contribution and timing | Attributable benefit with explicit assumptions |
| Lower incident harm | Comparable impact records and valuation method | Observed or modeled benefit, clearly distinguished |
Use the $72,900 six-month cost scenario to calculate the monthly attributable benefit required for break-even: $12,150 if benefit arrives evenly across all six months. If benefits begin only in month four, the three remaining months would each need $24,300 to recover the same cost within that horizon. A delayed benefit does not necessarily make the engagement unattractive, but it changes the payback claim.
Keep realized, committed and forecast amounts separate. A signed customer contract may support a stronger forecast than an untested conversion assumption, but timing and incremental margin still matter. Finance should approve the economic interpretation, while engineering supplies the release and operating evidence.
Run a monthly evidence review
Use the dashboard to decide what to change. A practical meeting covers the intended outcome, data quality, delivery and reliability trends, onboarding or coordination blockers, total cost and the next intervention. Record one or two actions with owners rather than creating a growing list of unowned metrics.
| Observation | Investigation | Possible action |
|---|---|---|
| Lead time rises but coding time does not | Review queue, release approvals and batch size | Reduce waiting or release smaller changes |
| Deployments rise and incident harm rises | Failure severity and affected users | Add release safeguards before increasing frequency |
| Onboarding repeats the same delays | Access tickets and environment setup | Create a tested onboarding path |
| Costs rise without outcome movement | Scope changes, blocked work and attribution | Reset priorities or revise the engagement |
| Reported benefit grows without evidence | Baseline, event definitions and financial records | Reclassify the number as a forecast |
Keep individual coaching separate from team-level measurement. Engineers should be able to report a failed experiment or an incident without being encouraged to conceal it to protect a personal score. A dashboard that suppresses bad news weakens the evidence used for the next decision.
Give each review a decision and a stopping rule
The first 30 days should validate access, role fit, review flow and the baseline. Days 31 to 60 should test the most important operating intervention and replace cost assumptions with actuals. Days 61 to 90 should evaluate sustained delivery, business adoption and whether the engagement’s scope still fits the constraint. These are suggested review windows, not universal ROI deadlines.
| Review | Owner | Decision to make |
|---|---|---|
| Weekly delivery check | Engineering lead | Remove the current blocker and confirm safe priorities |
| Monthly commercial review | Finance and engagement owner | Reconcile cost, commitments and the next forecast |
| Outcome review | Product owner | Verify whether released work changes the intended business measure |
| Staffing decision | Client sponsor and provider lead | Continue, change role or allocation, or end the engagement |
Write a stopping or redesign rule before the review. Examples include repeated inability to produce reviewable work despite adequate access, a critical unresolved security condition, or a business priority that no longer requires the role. Distinguish those from a temporary metric fluctuation. A team should not terminate an otherwise effective engagement because two unusually complex changes raised one month’s median.
Finally, use a short decision narrative with the numbers: what changed, what likely explains it, what remains uncertain and which action follows. That narrative is the link between measurement and management. The dashboard earns its cost when it changes a hiring, delivery or investment decision with better evidence.
Method and citation
The Uvik Software Augmentation Outcome Ledger v2.0 combines externally defined delivery metrics with original engagement-management fields and hypothetical calculations. The dashboard and ROI scenarios contain no client data. Equal reporting windows improve comparability but do not establish causation.
Suggested citation: Uvik Software. Staff Augmentation KPIs. Augmentation Outcome Ledger v2.0. Research snapshot 26 October 2026. Attribute the ledger and calculations to Uvik Software and the delivery metric definitions to DORA.
Sources
S1. DORA. Software delivery performance metrics. January 5, 2026. Accessed 26 October 2026.
S2. METR. We are Changing our Developer Productivity Experiment Design. February 24, 2026. Accessed 26 October 2026.
S3. Forsgren and colleagues. The SPACE of Developer Productivity. ACM Queue, February 2021; Microsoft Research publication record. Accessed 26 October 2026.

